

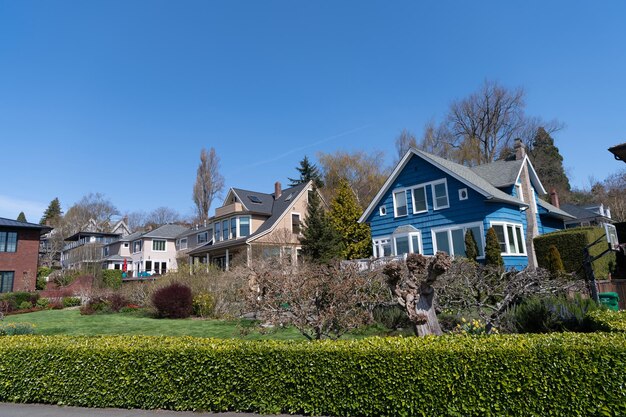
How Is The Housing Market For Homes For Sale In Columbus Ohio?
It changes month to month. For Columbus, the answer depends on how many homes are listed, how quickly they go under contract, and how close sale prices come to list. Those swing with the season and the neighborhood, so you need a fresh local snapshot to know exactly how it is today.
Watch a few core indicators. Months of supply tells you whether buyers or sellers have the upper hand. Days on market shows how fast homes are moving. The sale‑to‑list price ratio signals how much competition there is. Mortgage rates and the pace of new construction also shape what buyers can afford and how sellers price.
Expect some predictable patterns. Listings tend to be more plentiful in late spring and summer, with quieter activity in mid‑winter. Entry‑level price points often move faster than the top end, and condos or townhomes can behave differently than single‑family homes in the same area.
To see where things stand right now, look for a current monthly report from the regional multiple listing service, recent closed‑sale data from the county auditor or recorder, and an up‑to‑date mortgage‑rate index. For the clearest read, focus on your ZIP code and price range rather than the whole metro.
If you are making a decision today, check the latest local report and compare months of supply and days on market for the exact neighborhood and price band you care about.
Published: September 9, 2026 · Reviewed by the Whats Up Columbus editorial team